
Key Takeaways
- Markup percentage is based on cost, not revenue. Markup is the percentage added to a product’s cost to set a selling price, while margin is based on revenue, so the two should not be used interchangeably.
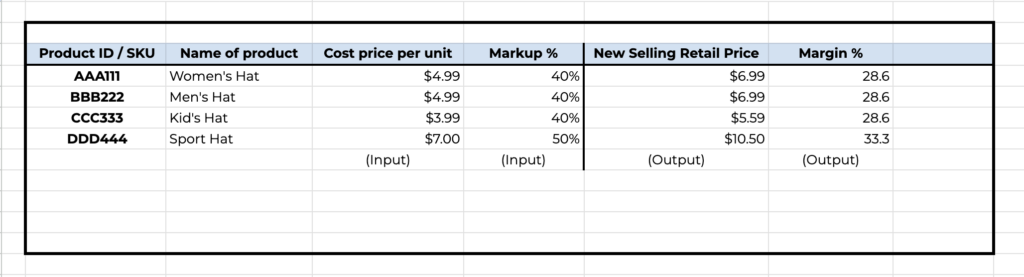
- The core markup formulas are simple and practical. The two main formulas: [(retail price – cost) / cost] x 100 to find markup percentage, and unit cost x (1 + markup) to calculate selling price.
- Markup strategy should go beyond math alone. Competitor pricing, market demand, product quality or sourcing costs, and profit goals all affect the right markup percentage.
- There is no universal “best” markup percentage. Average markups vary widely by category, with examples showing that convenience items, clothing, jewelry, food service, and baked goods can all have very different ranges.
- Better inventory management supports better pricing decisions. Markup is part of smarter inventory management, which allows businesses to price products more accurately, protect profits, and keep gross profit performance more consistent.
Introduction to Markup Percentage
In 2021, U.S. companies had their most profitable year since the 1950s, and much of that is a result of increasing markup averages across and within industries. The average markup percentage that same year was 72% above marginal cost.
Rising markups aren’t a new phenomenon. Research shows about a 25% increase overall between 2006 and 2019. Knowing what percentage to mark up your business’s goods is one of the most effective ways to manage financial goals, establish a benchmark for pricing, and stay profitable.
What Is a Markup Percentage?
Markup pricing, sometimes called cost-plus pricing, is the process businesses use to add a specific percentage of the cost to the price of their product to ultimately make a profit.
Though similar, markup percentages and profit margins are not the same. Both are often expressed in percentages, but your profit margin is the revenue your business earns after deducting all business costs. Markup considers profit as a portion of the cost of goods sold (COGS) instead of revenue. When you mark a product or service up, it has a domino effect on sales revenue and, eventually, your overall margin.
How to Calculate Selling Price Using Markup Percentage

A simple formula can help you calculate markup percentages for your products or services:
- [(retail price – cost) / cost] x 100 = markup percentage
You can also use an online markup calculator to save yourself the calculations. Some businesses and industries have specific markup formulas as part of a strategy. For example, anytime a retailer’s markup percentage involves doubling the wholesale cost, it’s called keystone pricing. Similarly, the cost plus pricing method builds on the basic markup percentage formula but with a slight adjustment for setting prices:
- unit cost x (1 + markup) = price
Many businesses apply markup-related formulas to other parts of their financial strategy by first calculating their COGS. A few examples include:
- Calculating markup of goods already sold: (Revenue – COGS) / COGS = markup ratio, multiplied by 100 for the percentage equivalent
- Setting a price with a predetermined markup ratio: (COGS x markup ratio) + COGS = the price to set for a product or service
You will likely calculate your markup percentage more than once in a given quarter, fiscal year or even a single month, depending on market fluctuations. If nothing else, you might consider adjusting your markup percentage to match the average annual growth rate of 2.3%.
Download A Free Markup Template
Factors to Consider When Calculating Markup Percentage
Using a formula is a reliable way to find your markup percentage, but it’s only one part of it. Multiple external factors significantly affect what your markup percentage should be to stay competitive, meet customer expectations, and match changing market conditions, like inflation, increased and decreased demand, and product costs.
Consider the Following When Calculating Markup
- Industry standards: Some industries have average markup percentages, and it’s good to research that information to stay within a reasonable range of any local competitors. That said, markup percentages can vary drastically, even within the same industry, so factoring in standards alone isn’t enough information to create a long-term markup strategy. You have to know the ins and outs of your local market. Industry standards also leave out the cost of product sourcing or production.
- Competitor pricing: Consider how your direct competitors within your market mark up prices on their goods and services. You can do this through competitor research, marketing, or you might contact your product’s manufacturer to see what their suggested price is to determine a threshold. Once you have a good idea of what your competitors are doing, you may choose to match or exceed their markup percentage or set prices slightly under that threshold if it’s part of your strategy. Don’t forget to include online retailers with similar items for sale — e-commerce sales are expected to account for nearly a quarter of all global sales by 2026.
- Market demand: Adapt your markup percentage as your market changes, accounting for fluctuations in your customers’ expected spending, inflation, and cost of living in your area, how quickly you sell a specific product, and any seasonal events that affect supply and demand, like holiday sales.
- Product quality: You can’t determine a profitable markup percentage without knowing how much it costs your business to source or create your product. A quick look at your ledgers will tell you how much it costs to resell any manufactured goods, but it’s more complex if you craft your own items and source materials to do so. You should also assign a value to the amount of work or time that goes into your product — especially if you make it yourself — as well as the demand for a product and how unique it is to your market.
- Profit goals: Your markup percentage should ultimately be enough to keep your business profitable and offset overhead. Use your markup ratio to monitor progress toward specific financial goals, like gross profit or profit-per-item.
Average Markup Percentages
There is no standard markup percentage you must or should meet, as so much of it depends on each business’s unique situation. That said, there are average markup percentages and expectations within specific industries. For example, perishable items are almost always marked up at a lower percentage than non-perishable items like clothes or electronics because there’s no rush to sell before they expire.
Average Markup Percentages for Various Retail Items
- Name-brand groceries: Name-brand goods are often marked up extra, even if the product is a near-match to a generic version. Name-brand spices average a 100% markup percentage, while name-brand cereal averages around 44%.
- Pre-prepared grocery foods: Pre-prepared food is marked up to account for the extra labor and additional products used. For example, pre-cut fruits and vegetables are marked up an average of 40%, and prepared meat — meat that’s already been chopped or marinated — has a 60% average markup.
- Convenience store items: According to the National Association of Convenience Stores (NACS), recent average markup percentages for convenience store items saw automotive products at 93%, health and beauty items at 132%, non-edible grocery items at 72%, candy at 100%, and general merchandise at 122%.
- Consumer goods: Consumer goods range in markup percentages. Clothing is often the highest-markup category, averaging between 100% and 300%. Jewelry is typically marked up 50%. Surprisingly, cell phones have an average markup of just 10%.
- Food service items: Restaurant food and beverages are marked up to an average percentage of 60% and up to 500%, respectively. Baked goods in grocery retail bakeries, like fresh bread or cakes, are marked up to an average of 300%.
There are also some standards for specific types of business. For example, small retail businesses typically use a 50% markup when setting prices.
Benchmark Pricing and Dynamic Pricing
In addition to understanding markup percentage, it’s crucial for e-commerce stores to consider benchmark pricing and dynamic pricing strategies. Benchmark pricing involves comparing prices with competitors to ensure your products are competitively priced, while dynamic pricing adjusts prices based on real-time supply and demand, customer behavior, and market conditions. Implementing these strategies can help maximize profits and remain competitive.
Why Is It Important to Understand Markup Percentages?
Most businesses rely on markup percentages to determine the best price for each product, especially when the business is new. Over-charging and under-charging can destroy sales, and using a consistent formula can help you find the best percentage for your market.
Understanding markup percentages also lets you use that figure as a baseline when tracking goal progress. While a markup percentage alone can’t tell you much about your actual net profits, they do give you a quick and easy way to ensure gross profit margins stay consistent and gives you a place to start experimenting with should those numbers suddenly drop.
Knowing your markup and comparing it to other factors, like item production expenses, can let you raise markup as needed to increase profits or take advantage of lower marginal costs.
What is a Markup Percentage Example
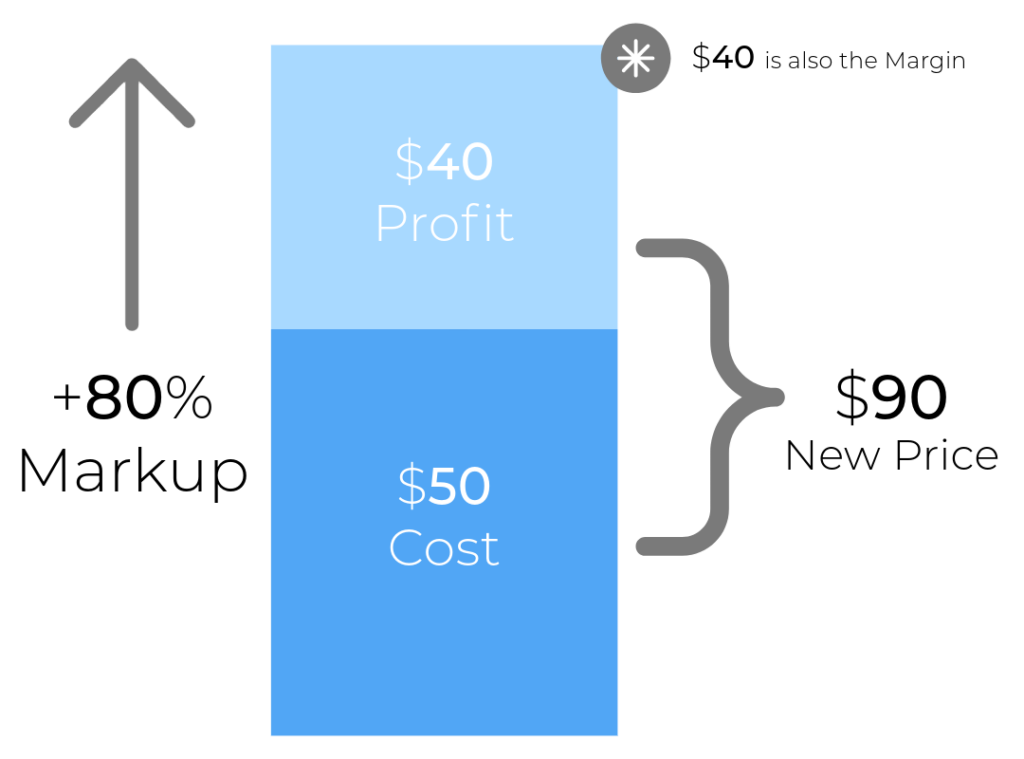
Let’s say you own an online store and purchase a dress for $50. You decide to mark it up by 80%. To find the selling price, you apply the markup percentage:
$50 * (1 + 0.80) = $90
In this example, you would sell the dress for $90, making a $40 profit over the cost.
The “1” represents the original $50 cost. The “0.80” adds 80% of that cost, which is $40.
So, when you multiply $50 by 1.80, you get $90. This means you would sell the dress for $90, which covers the original $50 cost plus an $40 profit.
Markup Vs Margin
Markup refers to the percentage added to the cost of a product to determine its selling price. It’s calculated based on the cost.
Margin is the percentage of the selling price that is profit, after accounting for the cost. It’s calculated based on the selling price.
Inventory Management Software Can Help You Manage Markup Percentages
Inventory management software from Descartes Finale™ offers an easy way to simplify inventory management, even if your business has multiple sales channels. Our fully scalable inventory management platform even includes a markup feature that lets you apply a standard markup percentage to your products and adjust it according to customer segment. As your COGS fluctuates, your sales price will use that markup percentage to automatically adjust your sales price along with it.
Schedule a demo today to see for yourself how Finale’s easy-to-use, efficient inventory management software can streamline operations for your business.
Markup Percentage FAQ
Is 20% margin the same as 25% markup?
Yes. A 20% gross margin is equivalent to a 25% markup on cost for the same item. Margin is based on selling price, while markup is based on cost.
How to calculate inventory markup?
Subtract the item’s cost from its selling price to get the markup amount, then divide that amount by the cost and multiply by 100. If you only need the markup in dollars, use: selling price minus cost.
What does 20% markup mean?
A 20% markup means the selling price is 20% higher than the item’s cost. For example, if an item costs $50, a 20% markup adds $10, so the selling price becomes $60.
What is a formula for markup percentages in inventory management?
Markup percentage = ((Selling Price – Cost) / Cost) x 100. In other words, you divide the profit per unit by the unit cost, not by the selling price.
Markup percentages inventory management example
If a product costs $80 and sells for $120, the markup amount is $40. Divide $40 by $80 and multiply by 100, which gives a 50% markup.
